MANAGE MY FLEET
Refining multiple driver and vehicle profiles into a singular useable screen for managers across the transportation industry.
The Brief
To redesign and modernise the SaaS, web application’s user interface and streamline the user journey.
Identify and improve problem areas.
Upgrade the UI components and patterns to modern standards.
The Process
Feedback was collected from clients via account managers.
Qualitative and quantitative data were gathered to cross reference with user feedback.
The updated feature was released as a BETA and more feedback was collected via survey before full release.
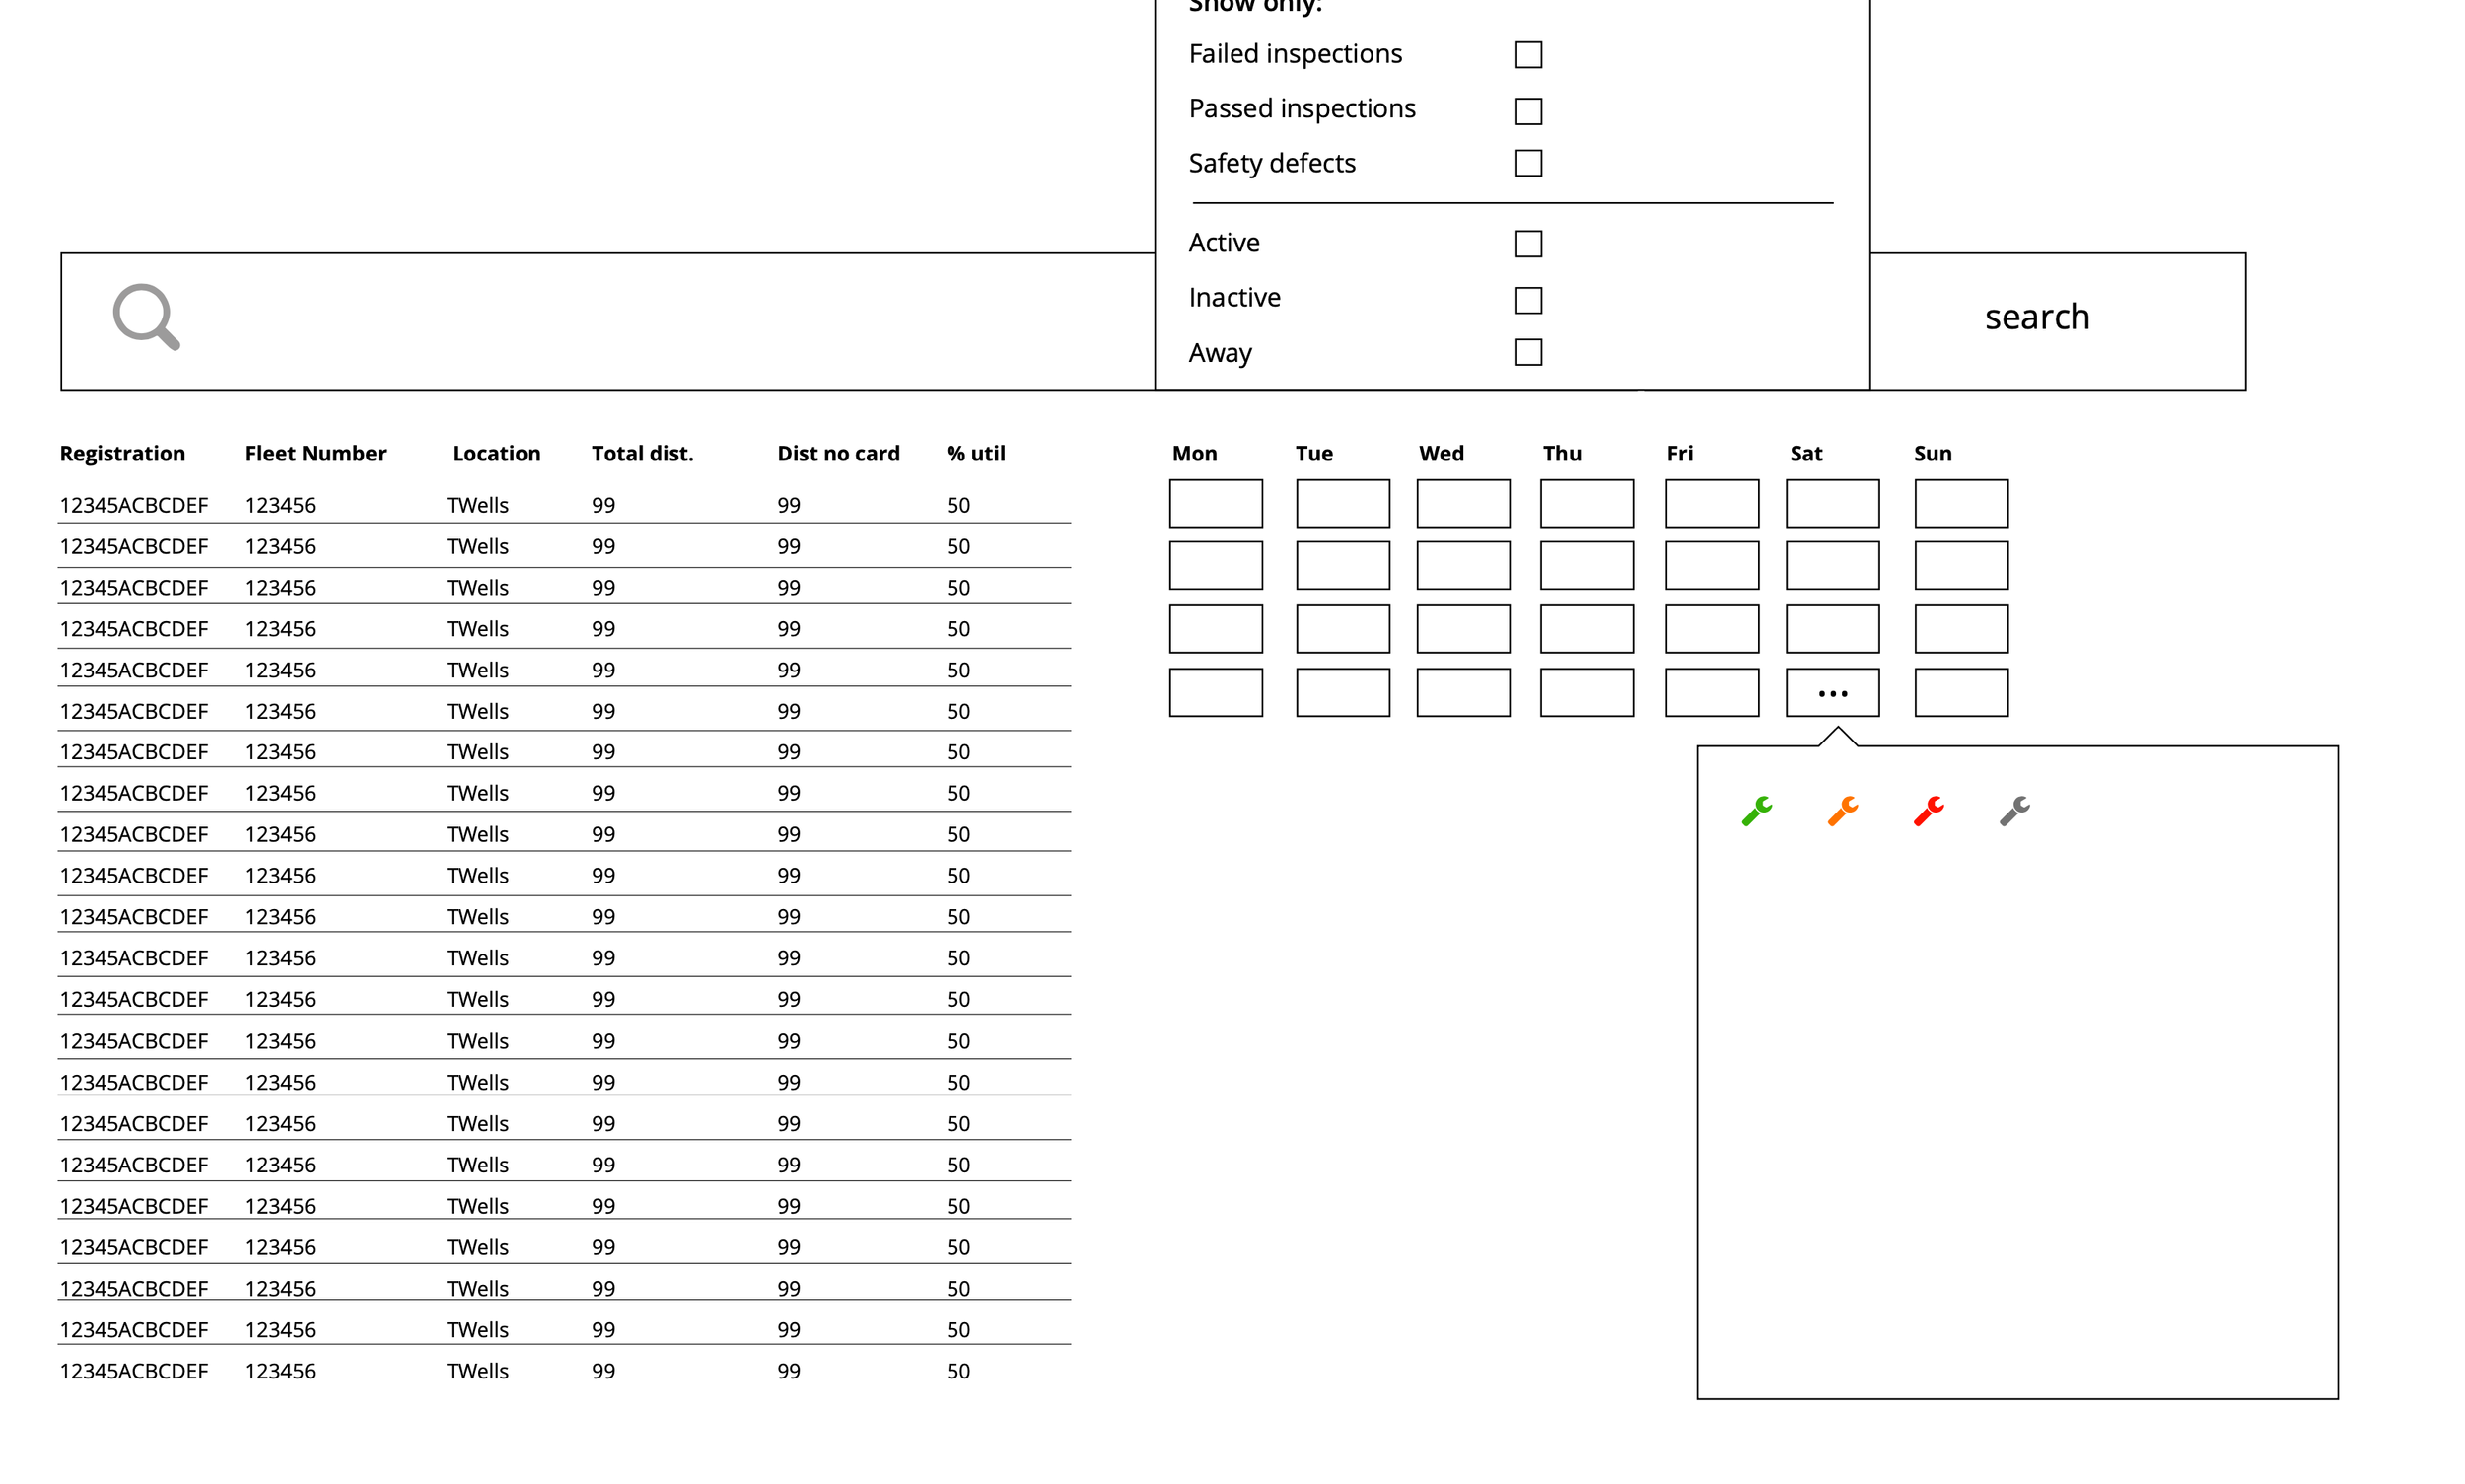
Colour coded icons for PCN severity
(following the pixel to data ratio rule for data visualization).Counter for PCN incidents per week.
Drill down for all incidents, reports and uploads.
WHAT WAS DELIVERED
Tab navigation to separate the calendar view into three separate, manageable views:
Tacho Data
Vehicle Maintenance
Penalty Charge Notices
Several online user tests were performed to find out from the users what of all the information available to them was considered most to least important.
Consistent patterns emerged specifically from gender and income sorting groups.
Heatmaps were used to look at desktop vs mobile scroll rate, and areas of highest attention.


